
A scaling study across five WIOWIZ hierarchies, from a three-file test to a 588-file automotive SoC of 2,673 instances.
Per design: files, instances, signals, compile wall, elaborate wall, memory, error count.
Then the caveat on comparing FSimX parse+elab to a Verilator runnable-model build.
Blog 01 covers why FSimX has its own front end. This article is not about that. It is the scaling profile: what happens when the same front end and elaborator are pointed at hierarchies from a three-file test to a 588-file automotive SoC, and what the wall-clock numbers say. All numbers are on the shipping FSimX binary (0.5.320-beta+550-g026d4795, flagship arm on the deployed 0.5.319-beta+549), Core Ultra 7 155H, 22 threads, 64 GB, with ~10 of 22 threads under sustained background load (disclosed).
The ceiling: a 588-file automotive SoC in about nine seconds
The largest workload FSimX has been measured on independently downstream is an automotive SoC: 588 source files, 2,673 instances, roughly 700,000 signals, 10,657 processes. FSimX parses and elaborates the whole hierarchy in about 9 seconds, with zero compile or elaboration errors on first try. This is a full chip, not a subsystem, and every downstream FSimX capability - four-state runtime, SVA evaluation, UVM stack, SDF back-annotation - runs against a hierarchy of this scale, not against a reduced stand-in.
| Stage | Number |
|---|---|
| Source files | 588 |
| Instances | 2,673 |
| Signals | ~700,000 |
| Processes | 10,657 |
| Parse + elaborate wall | ~9 s |
| Compile / elaboration errors | 0 |
The scaling profile across the flagship hierarchies
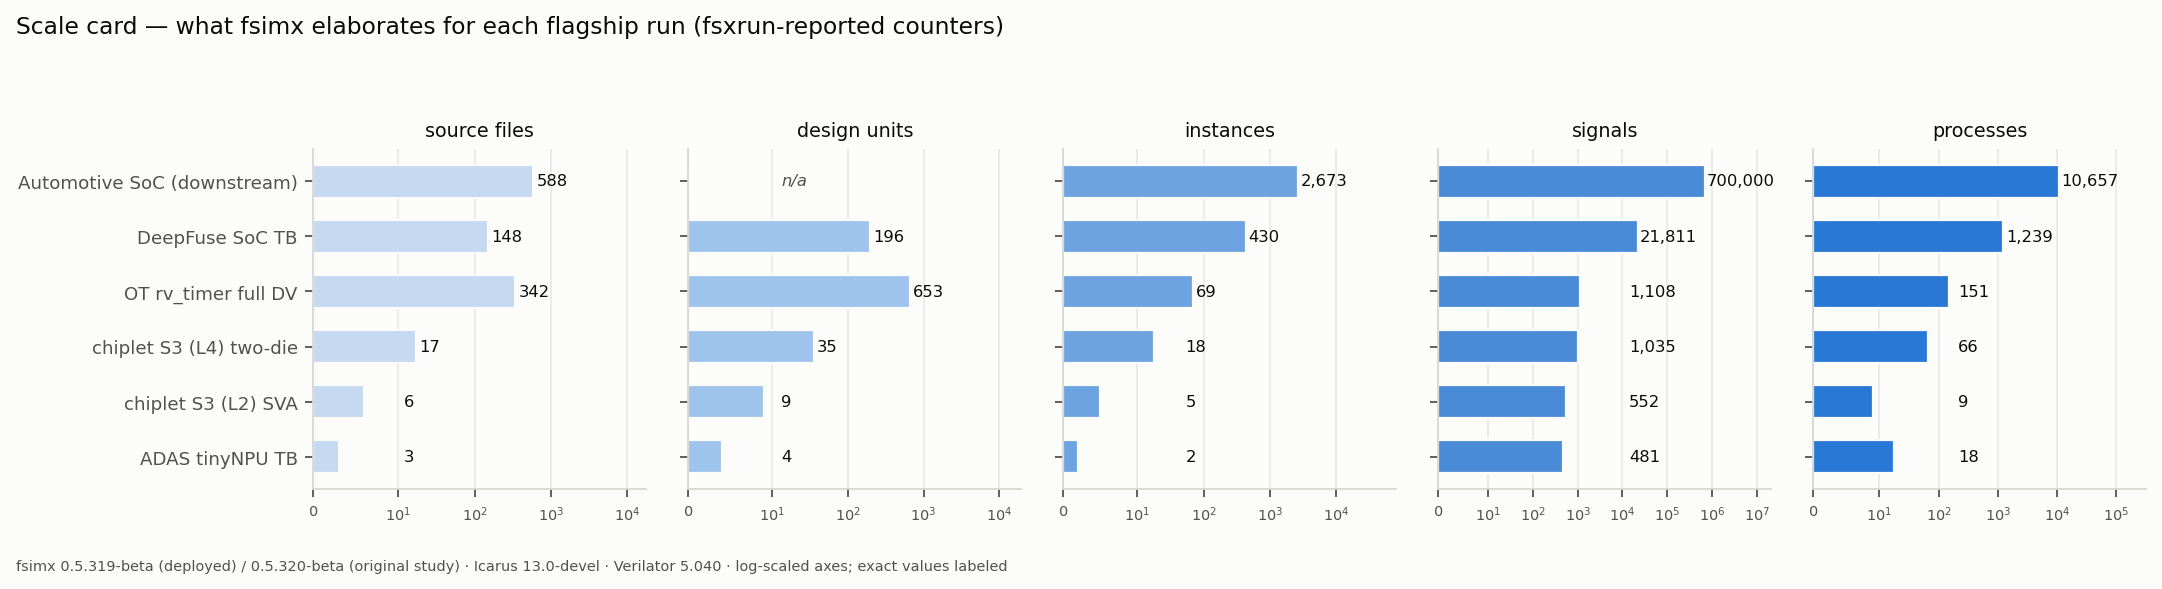
The card below is the elaboration scale across all five WIOWIZ flagship hierarchies used elsewhere in the series, so their sizes can be read on the same axis. Files, design units, instances, signals, processes.
| Hierarchy | Files | Instances | Signals | Parse + elaborate | Errors |
|---|---|---|---|---|---|
| Automotive SoC (independent downstream) | 588 | 2,673 | ~700k | ~9 s | 0 |
| DeepFuse sensor-fusion SoC TB | 148 | 430 | 21,811 | 0.69 s | 0 |
| rv_timer full UVM DV (upstream suite) | 342 | 69 | 1,108 | 4.15 s (elab 0.05 s) | 0 |
| chiplet S3 (L4) two-die (firmware + UCIe) | 17 | 18 | 1,035 | ~0.10 s | 0 |
| chiplet S3 (L2) adapter (BFM + SVA) | 6 | 5 | 552 | ~0.03 s | 0 |
| ADAS tinyNPU denoise TB | 3 | 2 | 481 | ~0.03 s | 0 |
The rv_timer row is a compile plus elaborate for a 342-file UVM environment, so its 4.15 second wall is a different stage from the RTL rows; the elaboration itself inside it is 0.05 seconds. The rest are RTL hierarchies elaborated in hundredths of a second to under a second, at whatever size they happen to be. None of them required a filelist workaround or a package-order fix to get through the front end.
The one call-out from the smaller designs
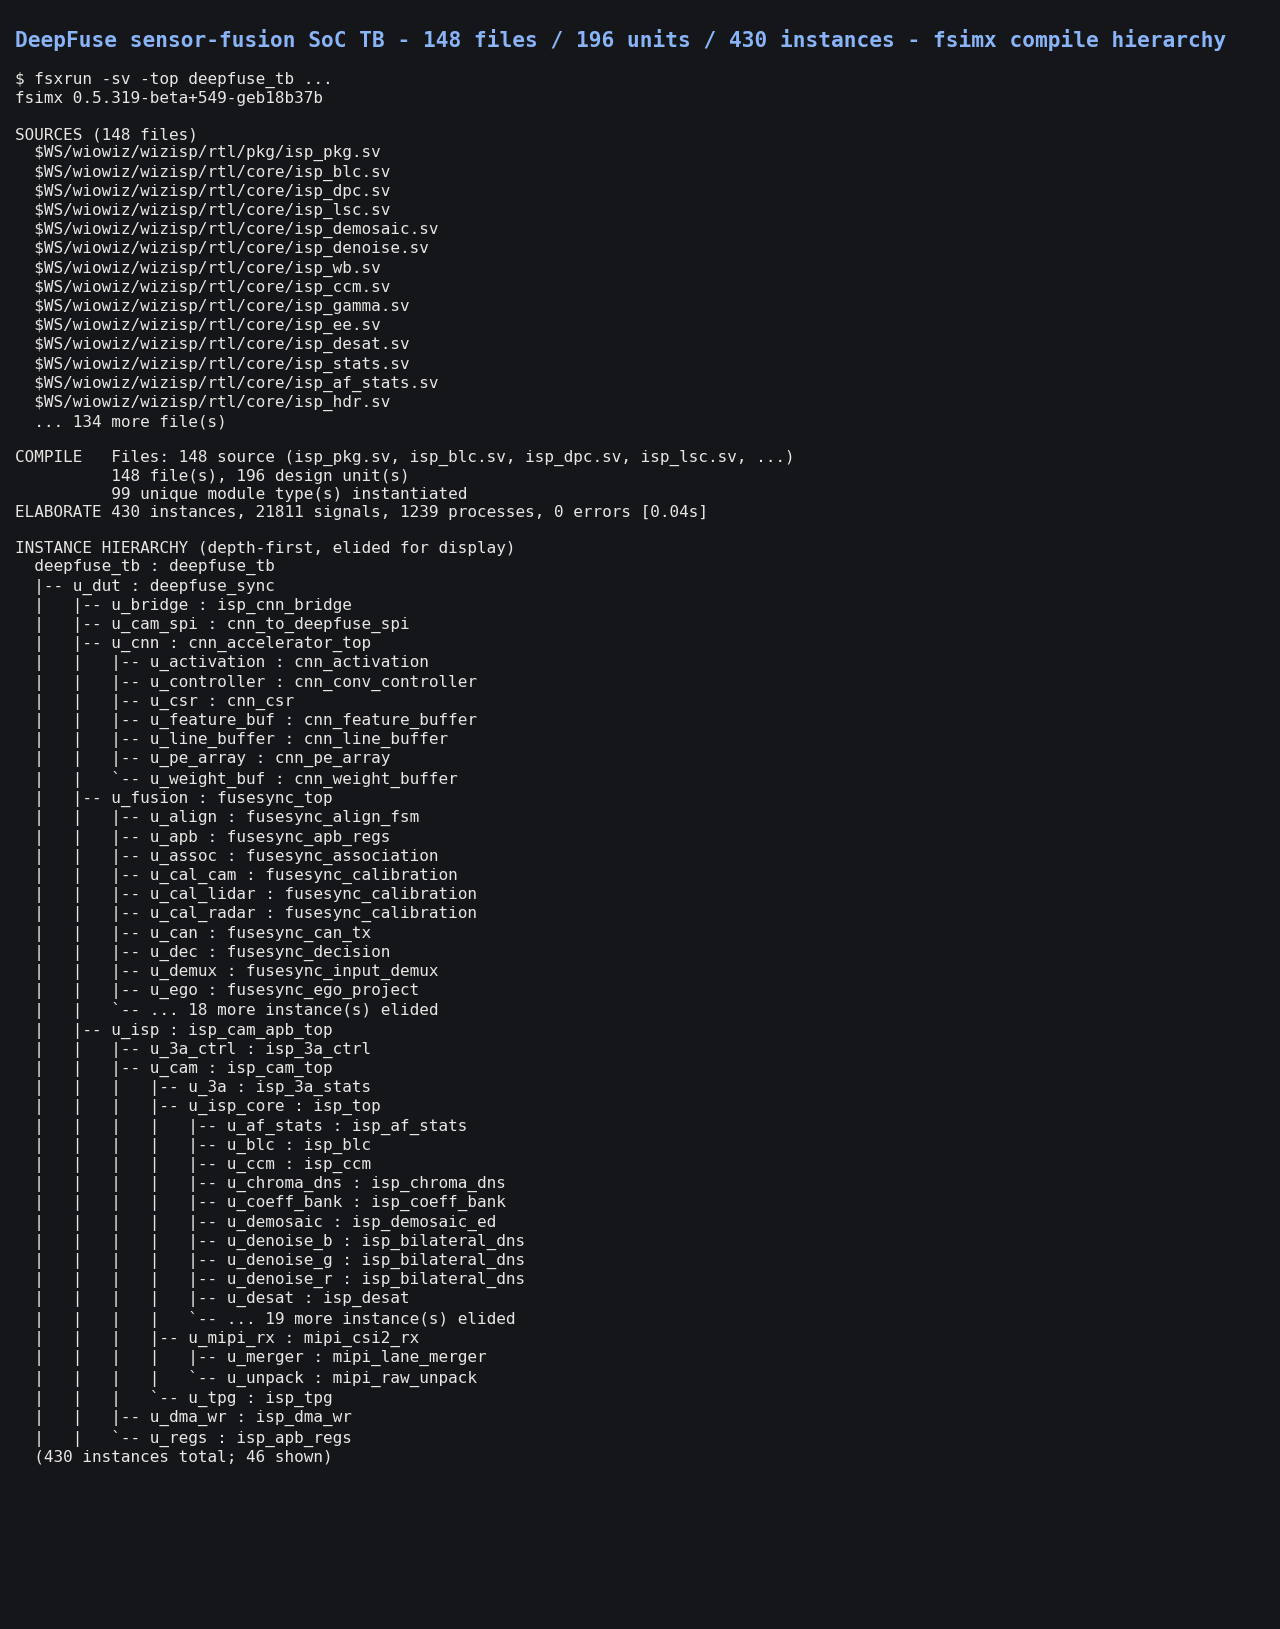
DeepFuse - the 148-file WIOWIZ-original sensor-fusion SoC testbench, at 430 instances and 21,811 signals - is the one design where the elaboration wall is close to the "first-cycle" wall, because there is no backend-build stage in between. FSimX turns those 148 files into a walkable depth-first instance tree in 0.69 seconds. That number matters for the interactive edit-run loop, not because 0.69 seconds is small in isolation, but because it is where FSimX finishes the front-end stage on this design.
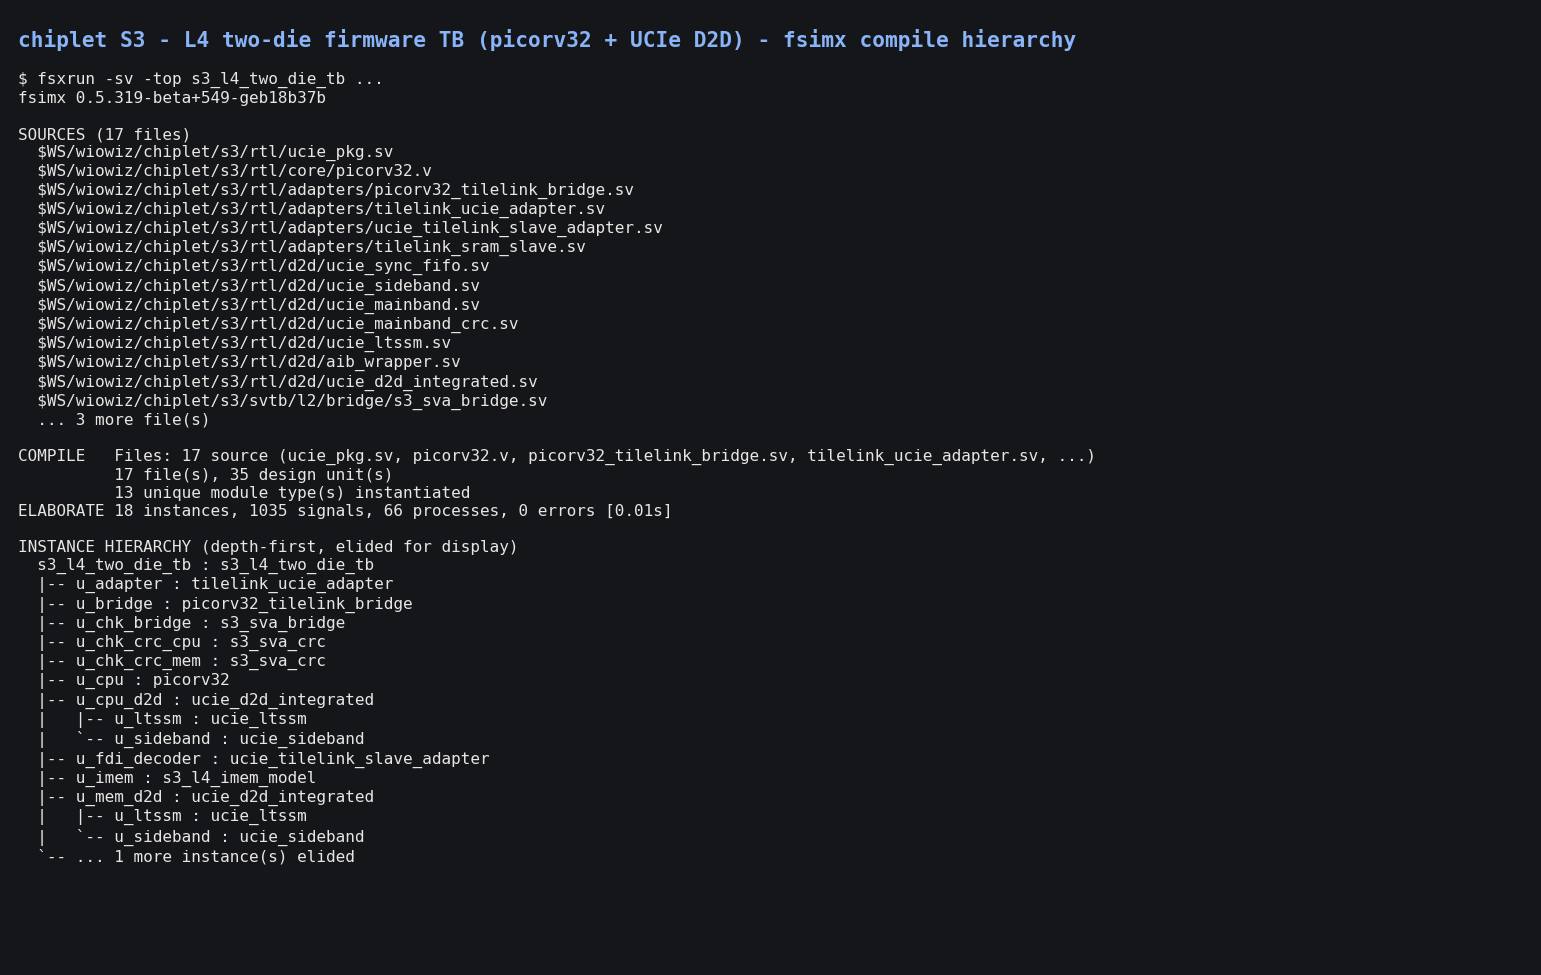
The chiplet S3 (L4) two-die hierarchy - a WIOWIZ-original running RV32I firmware on a picorv32 core across a TileLink fabric through a UCIe die-to-die link to a remote die - clears the front end in about a tenth of a second at 18 instances. Small design, same pipeline, same zero-error first try.
How to read the comparison note
The number the community usually reaches for is "how long until I can simulate the first cycle." That number involves different pipeline stages in different tools. For FSimX the wall is parse + elaborate; there is no backend-build stage between elaboration and simulation. For Verilator the wall is analyze + build a runnable model, after which simulation runs. On DeepFuse, FSimX finishes its parse+elab stage in 0.69 s and Verilator finishes its runnable-model build in 25.6 s (and only after discarding the covergroups it cannot compile on this workload, tested version). These are wall-clock times to a first cycle, useful in that framing, but the stages being compared are architecturally different and should not be labelled as "front-end speed" on either tool.
What the FSimX numbers do report cleanly is a scaling profile: at 3 files the wall is hundredths of a second, at 148 files it is under a second, at 342 files (UVM compile+elab) it is a few seconds, at 588 files it is about nine seconds. That progression - and the zero errors on every row - is what a scaling study measures.
What FSimX reports here is the wall-clock from 3 to 588 source files, on the shipping binary, with the error count on every row.
Backing numbers
- Automotive SoC (independent downstream): 588 files, 2,673 instances, ~700k signals, 10,657 processes, ~9 s, 0 errors
- DeepFuse: 148 files, 430 instances, 21,811 signals, 0.69 s, 0 errors
- rv_timer full UVM DV: 342 files, 69 instances, compile+elab 4.15 s (elab 0.05 s), 0 errors
- chiplet S3 (L4) two-die: 17 files, 18 instances, ~0.10 s, 0 errors
- chiplet S3 (L2) / ADAS: elaborated in hundredths of a second, 0 errors
- Comparison note: FSimX parse+elab is a different pipeline stage from Verilator's runnable-model build. On DeepFuse: 0.69 s vs 25.6 s wall-clock to a first cycle.
Run it yourself - FSiMX Studio
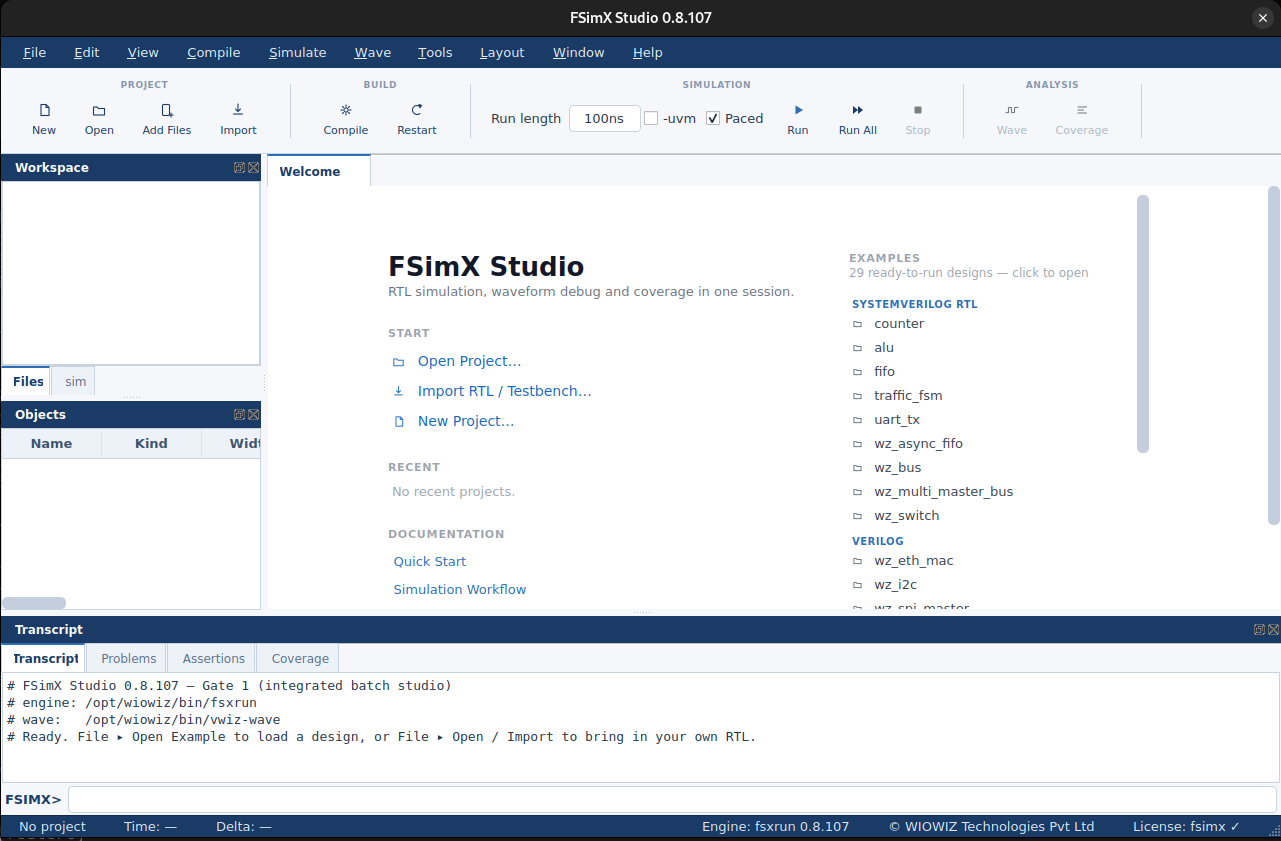
The native FSiMX engine described in this article ships in FSiMX Studio, a Docker bundle from the WIOWIZ website. Download it, build the image, and run the same elaboration, four-state and assertion behaviour you saw here, with FSiMX Wave and Asesha in the same window.
Download FSiMX Studio on wiowiz.ai →
Our Approach
We're building systems that think about specifications the way engineers do.
We build our own in-house EDA with an intelligence layer across it. Our stack covers the full flow,
from spec to comprehensive sign-off, on tools we build and control.
Walk-in ones, walk-in zeros